Results
As seen from the Fig. 3, independent variables in vigor class 1 and vigor class 2 were fairly normally distributed and equally varied. They were met the assumptions of T-test. Fig. 4 showed the barplots of independent variables in accordance to vigor class. It was seen that DBH, nitrogen (N, %), Maganese (Mn, ppm), Iron (Fe, ppm), Sodium (Na, ppm), and Alluminum (Al, ppm) were higher in vigor class 1 than vigor class 2. T-tests results showed that only DBH was significantly different (p<0.05, Table 5). Others were more than p-value of 0.05, therefore, there were no significant differences between vigor class 1 and vigor class 2.
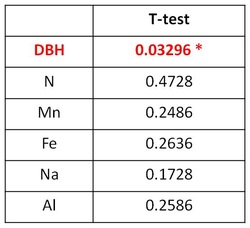
Table 5. The results of T-test. DBH was significantly different (p < 0.05).
Why is DBH correlated to vigor class? In other words, how is vigor class reflecting individual tree's health?
I further needed to investigate tree ring series to find out whether there is really significantly difference of tree growth between vigor class 1 and 2. Each tree ring width was measured and saved as a text file. I averaged each year's ring widths from 202 tree cores for vigor class 1 and 118 cores for vigor class 2. Then I drew growth curves for the last 60 years. There were some years that the trees classified as vigor class 2 grew more than vigor class 2 but for the last 20 decades, it was evident that the trees in vigor class 1 grew more than vigor class 2 (Fig. 5). In other words, vigor class 1 is relatively healthier than vigor class 2. DBH reflects tree growth directly and it indicated that vigor class could be used as an indicator of tree health. Therefore, vigor class is good to be used when forest managers decide which tree should be cut.
I further needed to investigate tree ring series to find out whether there is really significantly difference of tree growth between vigor class 1 and 2. Each tree ring width was measured and saved as a text file. I averaged each year's ring widths from 202 tree cores for vigor class 1 and 118 cores for vigor class 2. Then I drew growth curves for the last 60 years. There were some years that the trees classified as vigor class 2 grew more than vigor class 2 but for the last 20 decades, it was evident that the trees in vigor class 1 grew more than vigor class 2 (Fig. 5). In other words, vigor class 1 is relatively healthier than vigor class 2. DBH reflects tree growth directly and it indicated that vigor class could be used as an indicator of tree health. Therefore, vigor class is good to be used when forest managers decide which tree should be cut.
